Are you tired of manually monitoring your machine learning operations (MLOps) processes? Do you want to streamline your workflows and gain valuable insights into your data models? If so, it’s time to build an MLOps dashboard.
But where do you start? How can you create a personalized dashboard that meets your specific needs? In this article, we’ll explore the steps you need to take to build an MLOps dashboard that helps you manage your machine learning projects more efficiently.
What is MLOps?
Before we dive into building an MLOps dashboard, let’s define what MLOps is. MLOps is a set of practices that combines machine learning with DevOps to automate the entire machine learning lifecycle. This includes data preparation, model training, deployment, and monitoring.
MLOps is critical for organizations that want to scale their machine learning projects. By implementing MLOps, you can ensure that your machine learning models are reliable, scalable, and secure.
Why Do You Need an MLOps Dashboard?
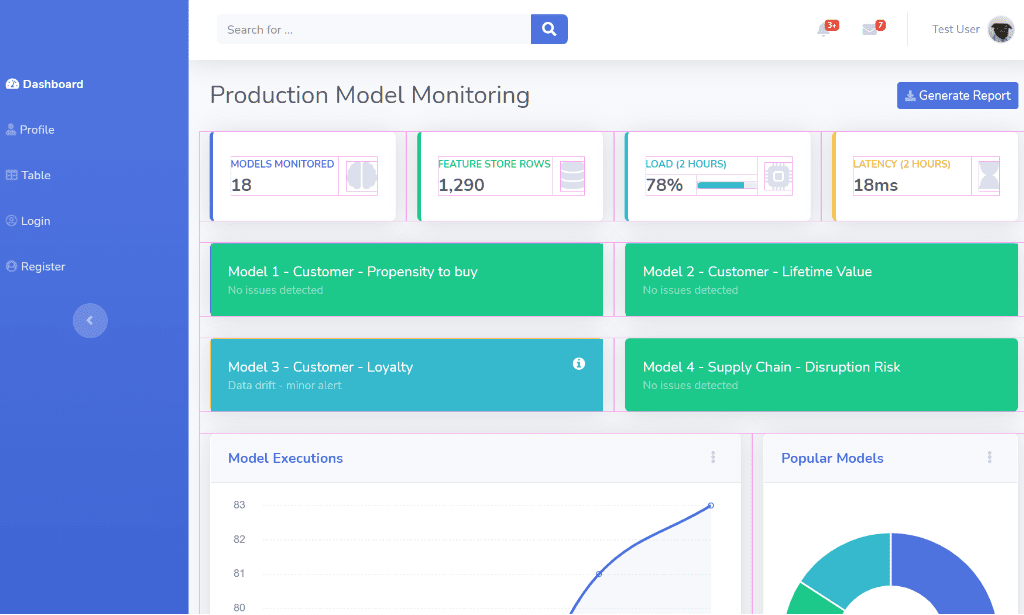
An MLOps dashboard is a centralized platform that gives you visibility into your machine learning operations. With a dashboard, you can:
- Monitor the performance of your machine learning models in real-time
- Identify and troubleshoot issues quickly
- Improve collaboration between data scientists, engineers, and other stakeholders
- Track the progress of your machine learning projects
- Make data-driven decisions based on insights from your machine learning operations
Overall, an MLOps dashboard helps you manage your machine learning projects more efficiently, saving you time and resources in the long run.
How to Build an MLOps Dashboard
Now that we’ve established why you need an MLOps dashboard, let’s dive into the steps you need to take to build one.
Step 1: Define Your Goals
Before you start building your dashboard, you need to define your goals. What do you want to achieve with your dashboard? What metrics do you want to track? What information do you want to display?
By defining your goals upfront, you can ensure that your dashboard is tailored to your specific needs.
Step 2: Choose Your Tools
Next, you need to choose your tools. There are many tools available for building MLOps dashboards, including open-source solutions like Grafana and commercial solutions like DataDog and Dynatrace.
When choosing your tools, consider factors like cost, ease of use, and compatibility with your existing infrastructure.
Step 3: Collect and Store Data
Once you’ve chosen your tools, it’s time to collect and store data. Your dashboard will only be as useful as the data it displays, so it’s essential to collect and store accurate and relevant data.
This may involve setting up logging and monitoring systems for your machine learning models, as well as integrating with your existing data storage solutions.

Step 4: Design Your Dashboard
With your data in place, it’s time to design your dashboard. This involves choosing the appropriate visualizations for your data and organizing them in a way that makes sense for your goals.
Remember to keep your design simple and intuitive. The purpose of your dashboard is to provide quick insights, not overwhelm users with information.
Step 5: Test and Iterate
Once you’ve designed your dashboard, it’s time to test and iterate. Test your dashboard with different users and use cases to ensure that it meets your goals and is easy to use.
Iterate on your dashboard based on user feedback and new insights from your machine learning operations.
Conclusion
Building an MLOps dashboard is a critical step towards managing your machine learning projects more efficiently. By defining your goals, choosing your tools, collecting and storing data, designing your dashboard, and testing and iterating, you can create a personalized dashboard that meets your specific needs.
Remember to keep your design simple and intuitive, and iterate on your dashboard based on user feedback to ensure that it remains relevant and useful over time. With the right tools and mindset, you can take your machine learning operations to the next level with an MLOps dashboard.